Using Visuals with Assessment Data
Figures and tables and charts can be incredibly useful as aids in the assessment
process in terms of showing assessment data to help people visualize performance
results. Assessment data helps students
visualize how they compare with their peers.
Assessment data helps parents understand expectations for their children
related to end of course exams and state expectations. Assessment data helps teachers understand
strengths of an entire class or even weaknesses of a particular assessment if
50% of the students missed the same question.
It is incredibly useful to look at assessment data visually to understand
how to use evaluation data to help guide further instruction or whether to recommend
tutoring or reteaching in a particular area.
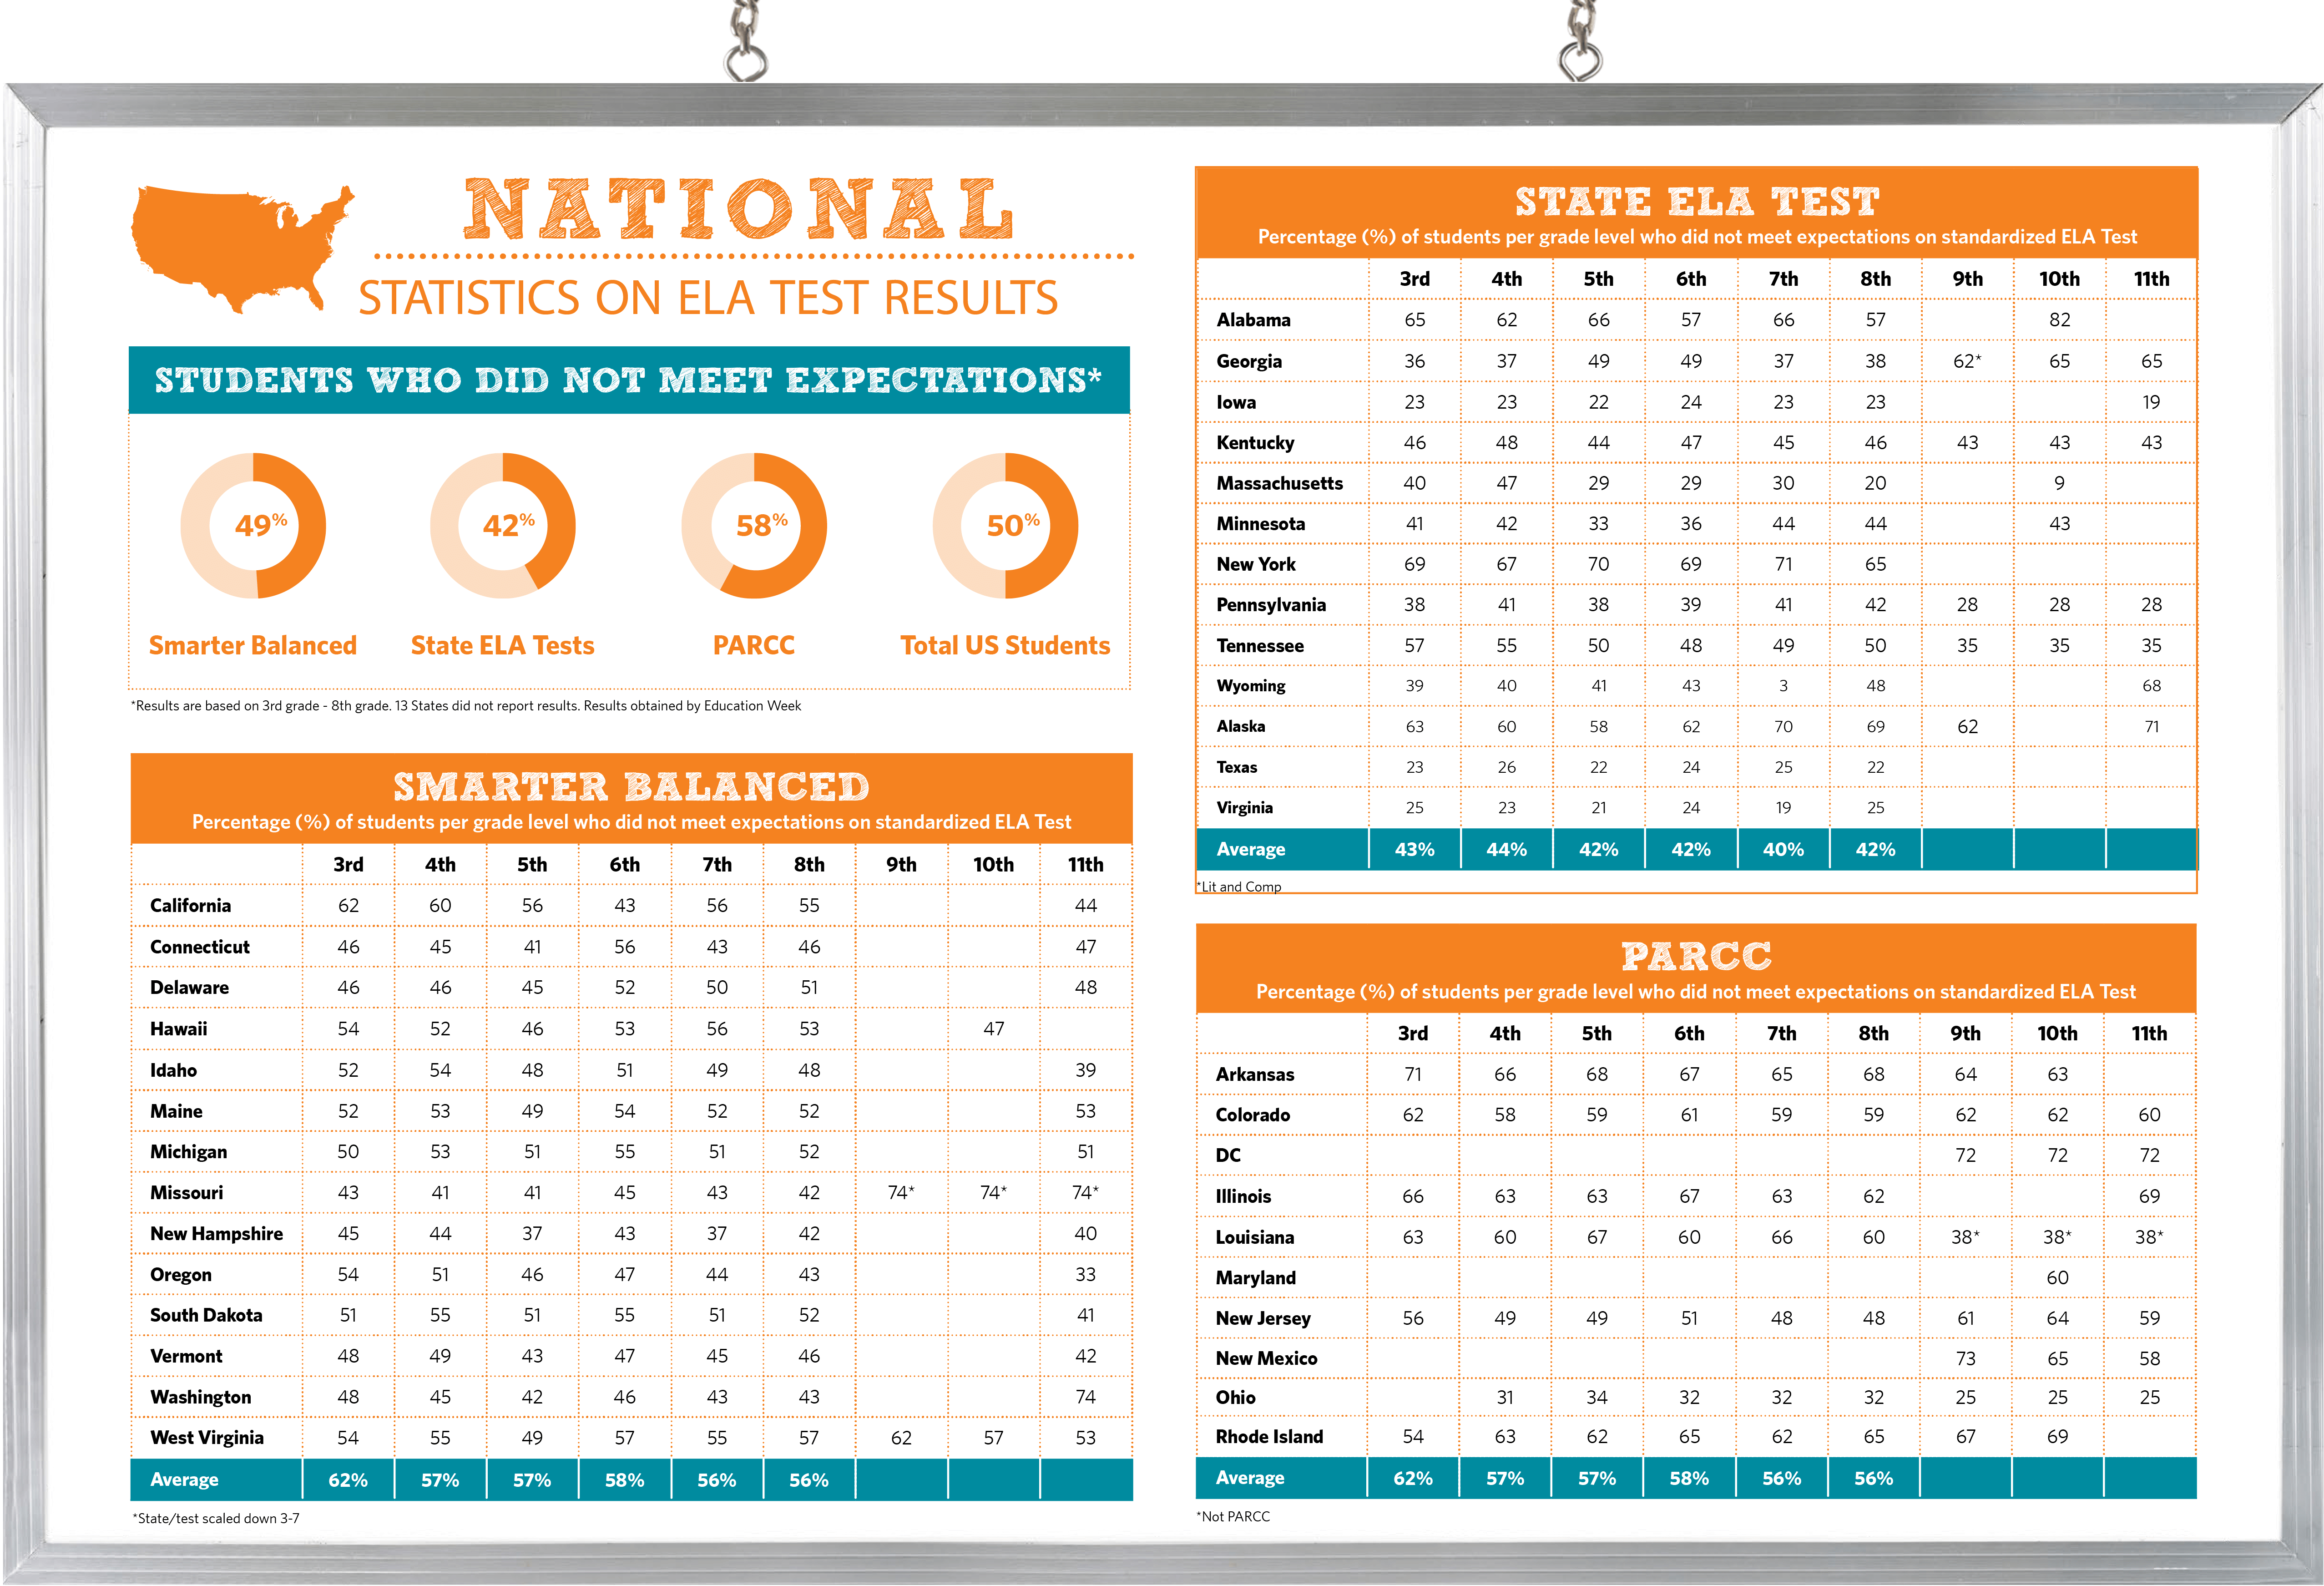
Figure 1
Sample Test Scores


Comments
Post a Comment